Nightingale Rose Diagram: Its Monthly Rates Are Yearly Rates
Published · Puzzles, Charts & Dilemmas
Folded answers print open where the browser allows it; if one prints closed, open it at https://puzzleschartsanddilemmas.com/charts/nightingale-rose-diagram/ first.
Where it lands
Florence Nightingale's 1858 rose diagrams do not plot how many soldiers died each month. Each wedge is an annual rate: that month's deaths scaled up to a full year, per 1,000 men of the army's estimated strength, which is why her own table prints 1,022.8 per 1,000 for deaths from disease in January 1855.
Sections on this sheet (5)
In 1858, Florence Nightingale printed diagrams of wedges showing how British soldiers in the East died. The natural reading is that a bigger wedge means more deaths that month, so the largest wedges mark the deadliest months. That reading skips two things the wedges carry: a denominator (the size of the army that month) and a multiplier that turns one month into a year. Here is the inference the wedges invite, written out as an argument.
In standard form:
- Premise 1:Each wedge shows how many soldiers died in one month.
- Premise 2:The disease wedges are far larger than the wound wedges.
- Therefore, conclusion:In the hospitals of the army in the East, far more soldiers died of disease than of wounds.
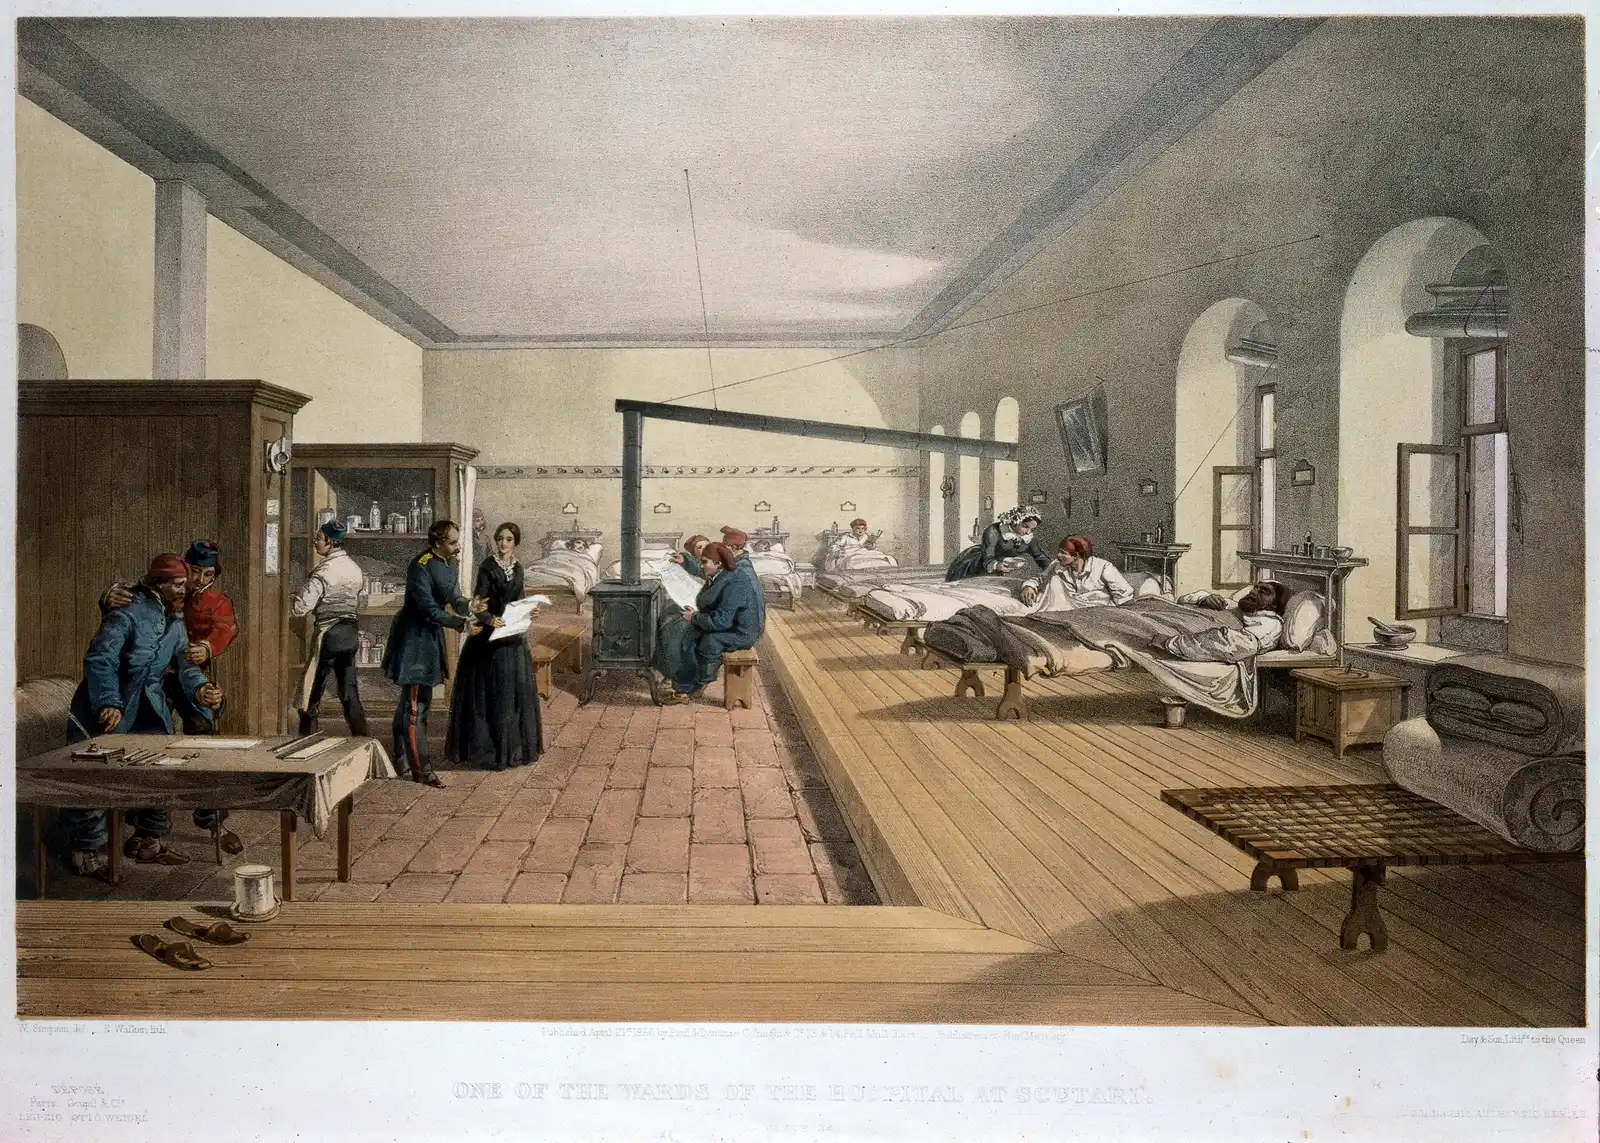
One of the wards of the hospital at Scutari, tinted lithograph by E. Walker after William Simpson, published 21 April 1856.
"One of the wards in the hospital at Scutari" by William Simpson (artist) and E. Walker (lithographer) — https://commons.wikimedia.org/wiki/File:%27One_of_the_wards_in_the_hospital_at_Scutari%27._Wellcome_M0007724.jpg — CC BY 4.0 (https://creativecommons.org/licenses/by/4.0/)
The conclusion survives a check against her numbers. P1 does not. The figures come from Table No. 2 on page 315 of her Notes on Matters Affecting the Health, Efficiency, and Hospital Administration of the British Army, and the table's title states exactly what each figure is: the “Annual Rate of Mortality per 1,000 in each month.” Restate P1 with that title, and the wedges have to be read differently.
Why a rate can pass 1,000
Table No. 2 covers the hospitals of the army in the East from April 1854 to March 1856. For each month it prints the army's estimated average strength, then the deaths in three classes, then an annual rate per 1,000 for each class. The classes are zymotic diseases (the book's name for its first class of disease, shortened to disease on this page), wounds and injuries, and all other causes.
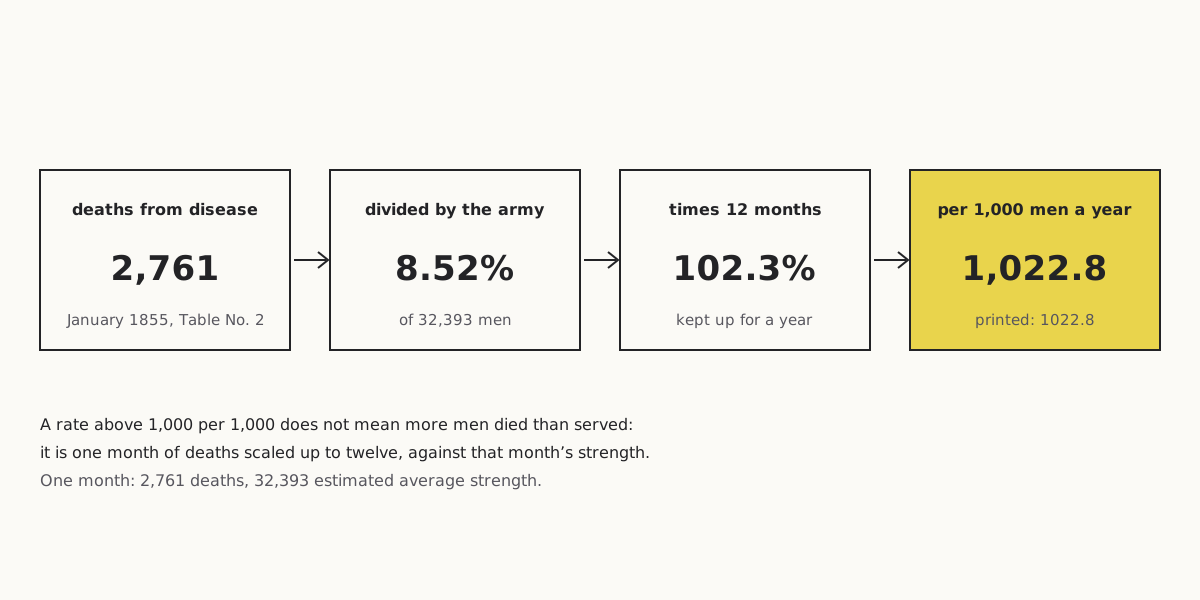
Take January 1855, the worst month in the table. The hospitals recorded 2,761 deaths from zymotic disease against an estimated average strength of 32,393: 8.52% of the army in a single month. Kept up for twelve months at the same pace, that becomes 102.3% a year. Per 1,000 men, it is 1,022.8.
Wide figure: scroll it sideways, or open it full size.
January 1855: one month's deaths from disease turned into a yearly rate per 1,000 men.
Diagram: Puzzles, Charts & Dilemmas, CC BY 4.0
Copy the full credit line
"Nightingale 1858: January 1855 death rate, step by step" by Puzzles, Charts & Dilemmas, https://puzzleschartsanddilemmas.com/charts/nightingale-rose-diagram/, licensed under CC BY 4.0 (https://creativecommons.org/licenses/by/4.0/).
Data: Florence Nightingale, Notes on Matters Affecting the Health, Efficiency, and Hospital Administration of the British Army (1858), Table No. 2, p. 315; Wellcome Library copy, public domain
A rate above 1,000 per 1,000 does not mean that more men died than served. It describes a pace, not a total. It answers a hypothetical question: what a full year at January's pace would look like, measured against January's strength. The army's size and its death toll both changed from month to month, so the rate per 1,000 men, not the count, is what lets one month be compared fairly with another.
We recomputed every rate in the table from its own deaths and strength: deaths times 12, divided by strength, times 1,000. All 72 printed rates (24 months, three causes) match our figures to one decimal place. January 1855 is the only month in which the disease rate passes 1,000. That month, the rate for all three causes together is 1,173.5.
A second table, a different unit
The table on the facing page uses another unit. That is one more reason to read the label before the number. Table No. 1 on page 314 gives the “Annual Rate of Mortality per cent.” for the army in the East and for English men aged 15 to 45, in “Deaths Annually to 100 living.”
By that table, zymotic disease killed 18.7 per 100 a year in the army against 0.2 in the civilian comparison group, and all causes together 22.9 against 1.0. Those are yearly percentages for a period the table's title does not state, so they cannot be set beside the 1,022.8 of a single winter month without converting units and checking dates first.
Same data, redrawn
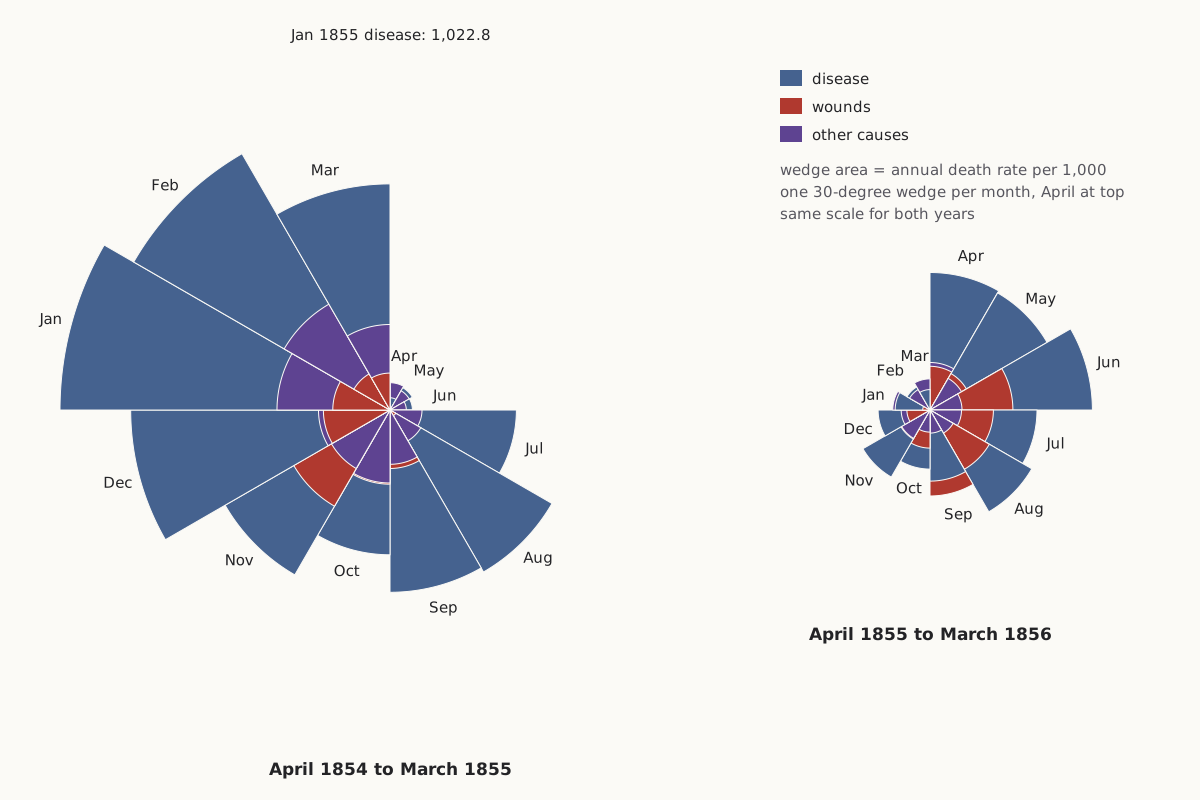
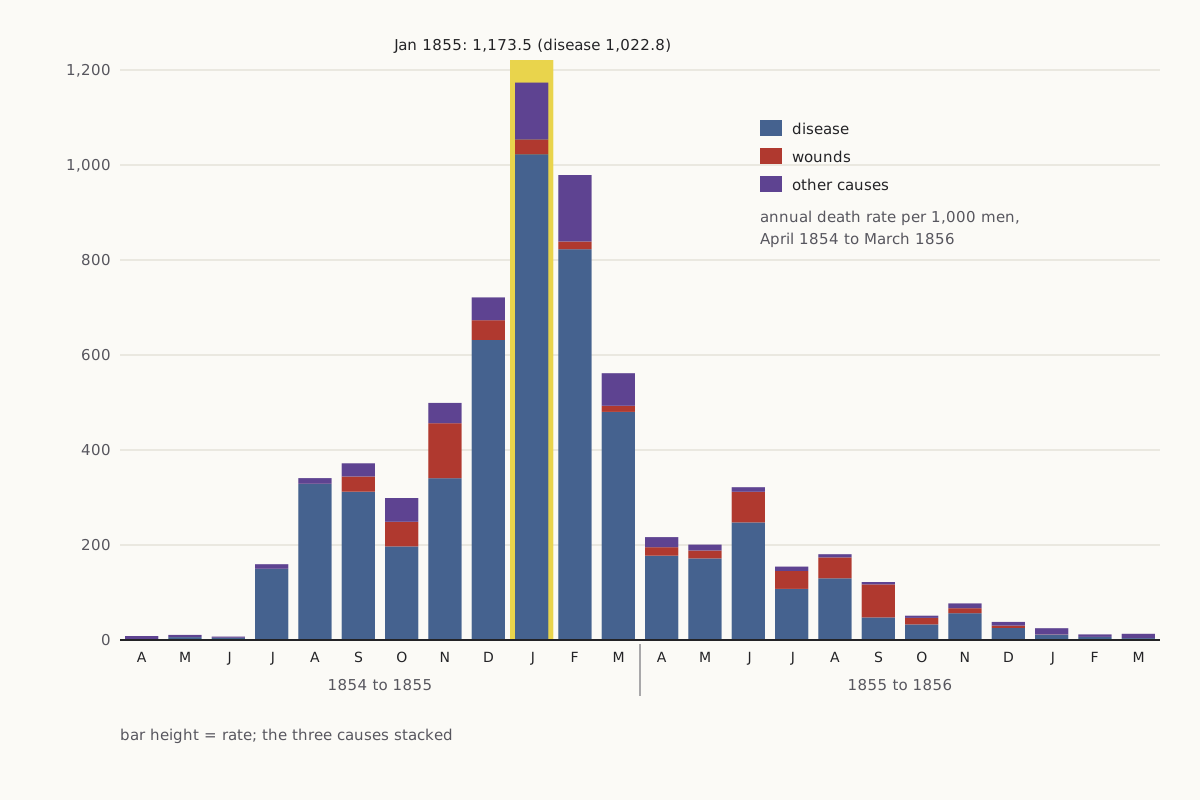
Both charts below are drawn from the same 24 rows of Table No. 2. The first keeps her encoding, in which the area of each wedge stands for a rate. The second places the identical rates on a straight vertical scale.
As first charted
Wide figure: scroll it sideways, or open it full size.
The 24 monthly rates drawn as two roses, one wedge per month, with each cause's area set by its annual rate.
Diagram: Puzzles, Charts & Dilemmas, CC BY 4.0
Copy the full credit line
"Nightingale 1858 table redrawn as area-coded roses" by Puzzles, Charts & Dilemmas, https://puzzleschartsanddilemmas.com/charts/nightingale-rose-diagram/, licensed under CC BY 4.0 (https://creativecommons.org/licenses/by/4.0/).
Data: Florence Nightingale, Notes on Matters Affecting the Health, Efficiency, and Hospital Administration of the British Army (1858), Table No. 2, p. 315; Wellcome Library copy, public domain
Same numbers, redrawn
Wide figure: scroll it sideways, or open it full size.
The same rates as stacked bars on a linear axis, one bar per month.
Diagram: Puzzles, Charts & Dilemmas, CC BY 4.0
Copy the full credit line
"Nightingale 1858 table: annual death rates as stacked bars" by Puzzles, Charts & Dilemmas, https://puzzleschartsanddilemmas.com/charts/nightingale-rose-diagram/, licensed under CC BY 4.0 (https://creativecommons.org/licenses/by/4.0/).
Data: Florence Nightingale, Notes on Matters Affecting the Health, Efficiency, and Hospital Administration of the British Army (1858), Table No. 2, p. 315; Wellcome Library copy, public domain
The rose is not wrong. Each wedge's area matches a printed rate, and our two roses share one scale, so the second year really is smaller than the first. What the rose softens is the size of the change, because a reader who compares how far the wedges reach is comparing square roots of the rates. On the bars the fall is plain: all three causes together drop from 1,173.5 in January 1855 to 24.9 in January 1856.
The bars also show a pattern that the rose makes easy to miss. In the first winter, disease dominates every month. In the summer and autumn of 1855, the wound slices grow noticeably. September 1855 is the only month of the 24 in which the table records more deaths from wounds (276) than from disease (189).
| Month | Strength | Disease deaths | Wound deaths | Other deaths | Disease rate | Wound rate | Other rate |
|---|---|---|---|---|---|---|---|
| Sep 1854 | 30,290 | 788 | 81 | 70 | 312.2 | 32.1 | 27.7 |
| Dec 1854 | 32,779 | 1,725 | 114 | 131 | 631.5 | 41.7 | 48.0 |
| Jan 1855 | 32,393 | 2,761 | 83 | 324 | 1,022.8 | 30.7 | 120.0 |
| Feb 1855 | 30,919 | 2,120 | 42 | 361 | 822.8 | 16.3 | 140.1 |
| Jun 1855 | 38,863 | 802 | 209 | 31 | 247.6 | 64.5 | 9.6 |
| Sep 1855 | 47,751 | 189 | 276 | 20 | 47.5 | 69.4 | 5.0 |
| Jan 1856 | 44,212 | 42 | 2 | 48 | 11.4 | 0.5 | 13.0 |
Rates are deaths per 1,000 men per year, as printed. All 24 months are in the CSV under Sources.
Area, not length
A wedge in the rose has a fixed angle of 30 degrees, one twelfth of the circle for each month. Its size therefore depends on its radius, and the area of a wedge grows with the square of that radius. To make area proportional to the rate, the radius has to grow with the square root of the rate. The folding plate in the copy of the 1858 book we read says its wedges compare “area for Area, with every other wedge.”
That choice has a cost for the reader. Anyone who judges a wedge by how far it reaches is reading the radius, not the area. A rate four times larger reaches only twice as far. Draw the same numbers with the radius set to the rate instead, and the large months swell far beyond their real share.
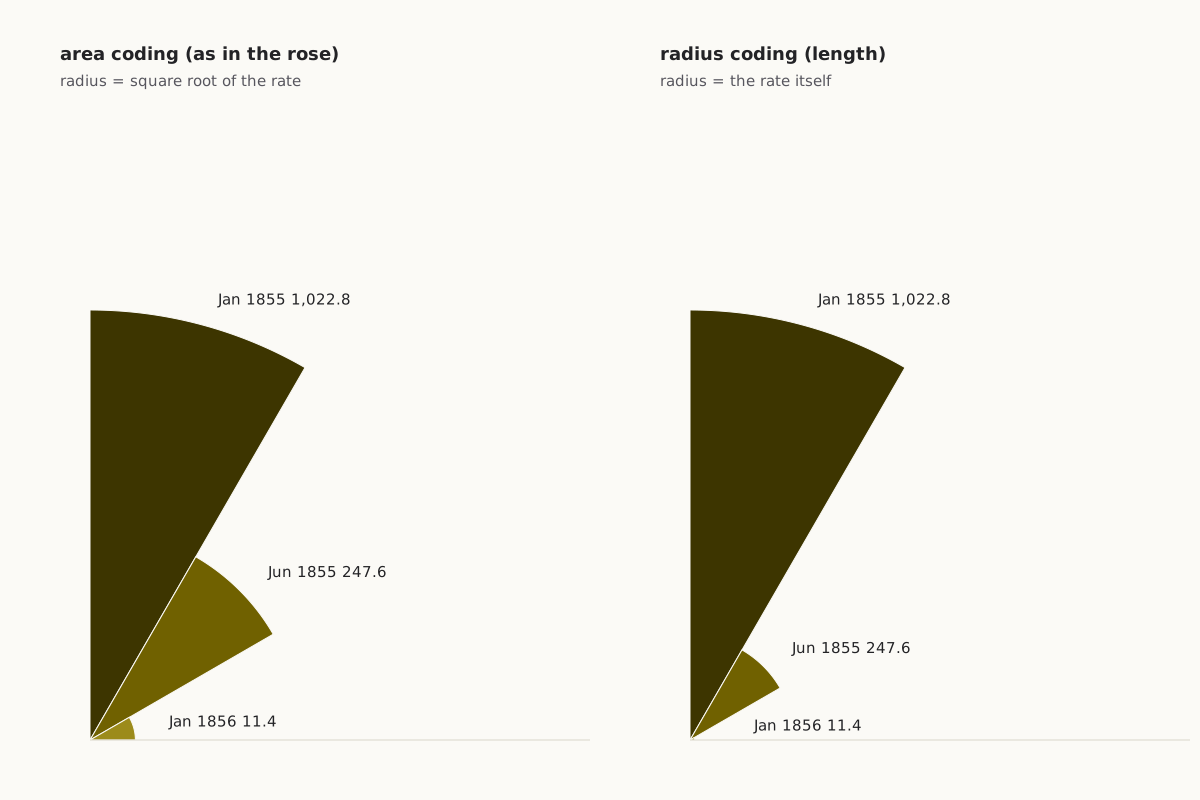
Wide figure: scroll it sideways, or open it full size.
Three disease rates drawn twice: once with area set to the rate, as in the rose, and once with radius set to the rate.
Diagram: Puzzles, Charts & Dilemmas, CC BY 4.0
Copy the full credit line
"Three rates with area coding and with radius coding" by Puzzles, Charts & Dilemmas, https://puzzleschartsanddilemmas.com/charts/nightingale-rose-diagram/, licensed under CC BY 4.0 (https://creativecommons.org/licenses/by/4.0/).
Data: Florence Nightingale, Notes on Matters Affecting the Health, Efficiency, and Hospital Administration of the British Army (1858), Table No. 2, p. 315; Wellcome Library copy, public domain
Try it first: In the redrawn rose, the January 1855 disease wedge stands for 1,022.8 and the January 1856 one for 11.4. By area, how many times larger is the first? By radius?
Show it worked through
Worked through
By area, 1,022.8 divided by 11.4 is 89.7, so the January 1855 wedge covers 89.7 times the area of the January 1856 one.
The radius ratio is the square root of that, about 9.5. The bigger wedge reaches only 9.5 times as far from the centre, even though its rate is 89.7 times higher.
If the radius had been set to the rate itself, the area ratio would have been 89.7 squared, about 8,050. That version, not the area-coded rose, would be the misleading one.
| Pair of months | Rates per 1,000 per year | Area ratio | Radius ratio (area-coded) |
|---|---|---|---|
| Jan 1855 vs Jan 1856 | 1,022.8 vs 11.4 | 89.7 | 9.5 |
| Jan 1855 vs Jun 1855 | 1,022.8 vs 247.6 | 4.1 | 2.0 |
| Jun 1855 vs Jan 1856 | 247.6 vs 11.4 | 21.7 | 4.7 |
Reading a rose like this one
The same checks work on any polar area chart, whatever it measures:
- Find the label that says what one wedge measures, including its unit and time span (here, deaths per 1,000 per year, for one month).
- Find the denominator behind each value (here, the estimated average strength of the army that month).
- Check whether area or radius carries the value (here, area, as the plate's key states).
- Compare two wedges by their numbers, or redraw them as bars on a linear axis, before trusting the impression of size.
The table behind the roses
A rate needs two numbers, and the table prints both of them. The deaths column on its own would be the lone count: “2,761 deaths from disease in January 1855” says nothing about how many men were at risk. The strength column supplies the missing denominator, and it changed a great deal over the two years.
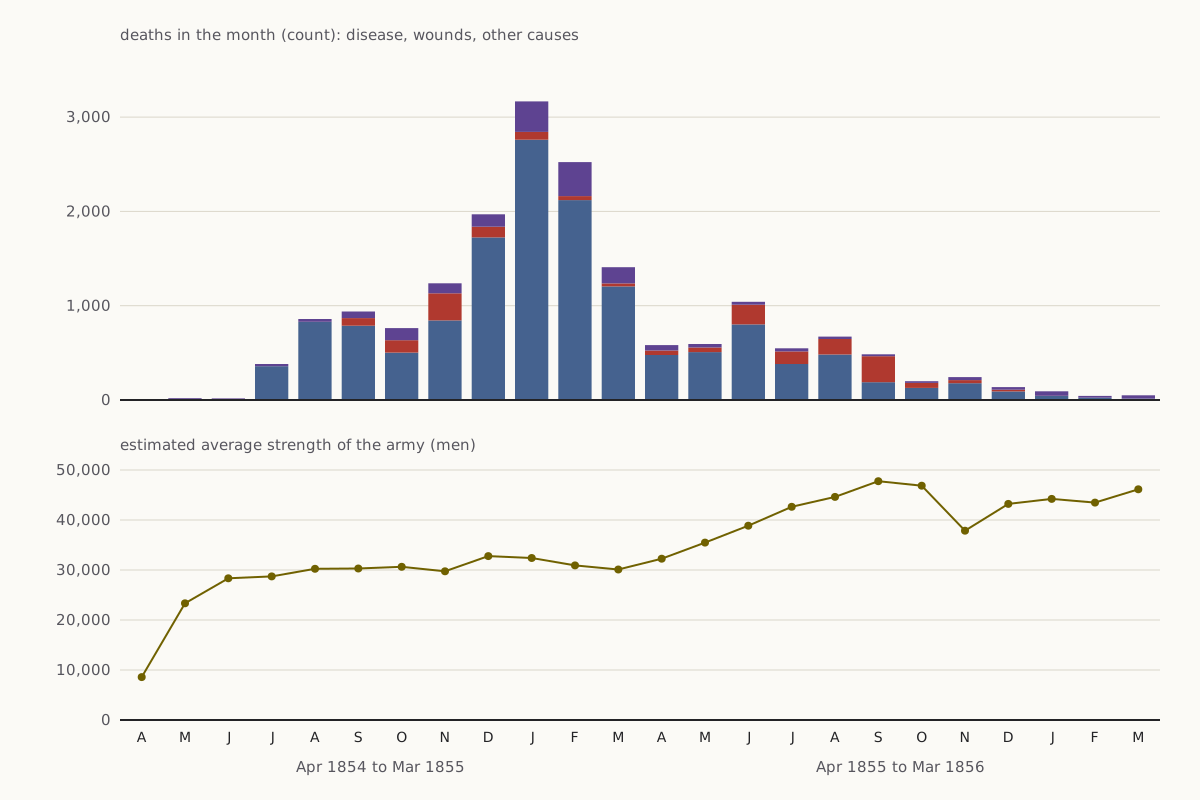
Wide figure: scroll it sideways, or open it full size.
Monthly deaths (top) and the army's estimated average strength (bottom), each on its own axis.
Diagram: Puzzles, Charts & Dilemmas, CC BY 4.0
Copy the full credit line
"Nightingale 1858 table: monthly deaths and army strength" by Puzzles, Charts & Dilemmas, https://puzzleschartsanddilemmas.com/charts/nightingale-rose-diagram/, licensed under CC BY 4.0 (https://creativecommons.org/licenses/by/4.0/).
Data: Florence Nightingale, Notes on Matters Affecting the Health, Efficiency, and Hospital Administration of the British Army (1858), Table No. 2, p. 315; Wellcome Library copy, public domain
According to the table, the army numbered 8,571 men in April 1854 and 46,140 in March 1856. The same number of deaths would therefore produce a much lower rate in the second year than in the first. In December 1854, 1,725 deaths from disease against 32,779 men gave 631.5 per 1,000, while in June 1855, 802 deaths against 38,863 men gave 247.6.
The Ship of Theseus page runs into the same gap with planks, where a count of replaced timbers means nothing until you know how many there were. Here the gap is wider, because the denominator is itself an estimate. The table calls it the “Estimated Average Monthly Strength of the Army,” and we have no second source to check it against.
Over all 24 months, the table records 14,476 deaths from zymotic disease, 1,758 from wounds and injuries, and 1,748 from other causes, or 8.2 deaths from disease for every death from wounds. Conclusion C therefore holds in her figures, within her scope: deaths in the hospitals of the army in the East, from April 1854 to March 1856.
What the 1858 plate shows
The book's list of illustrations names two diagrams for this part of the book: a “Diagram of the Causes of Mortality in the Army in the East” at page 315 and a “Diagram of the Mortality in the Army in the East” at page 320. The page images we read come from the Wellcome Library's copy, which the Internet Archive digitized and which is marked public domain.
In that copy, the folding plate we found near these pages is titled “Diagrams of the Mortality in the Army in the East,” and it holds two roses. The larger, at right, is numbered 1 and covers April 1854 to March 1855, while the smaller, at left, is numbered 2 and covers April 1855 to March 1856. A dashed line joins the end of the first year to the start of the second.
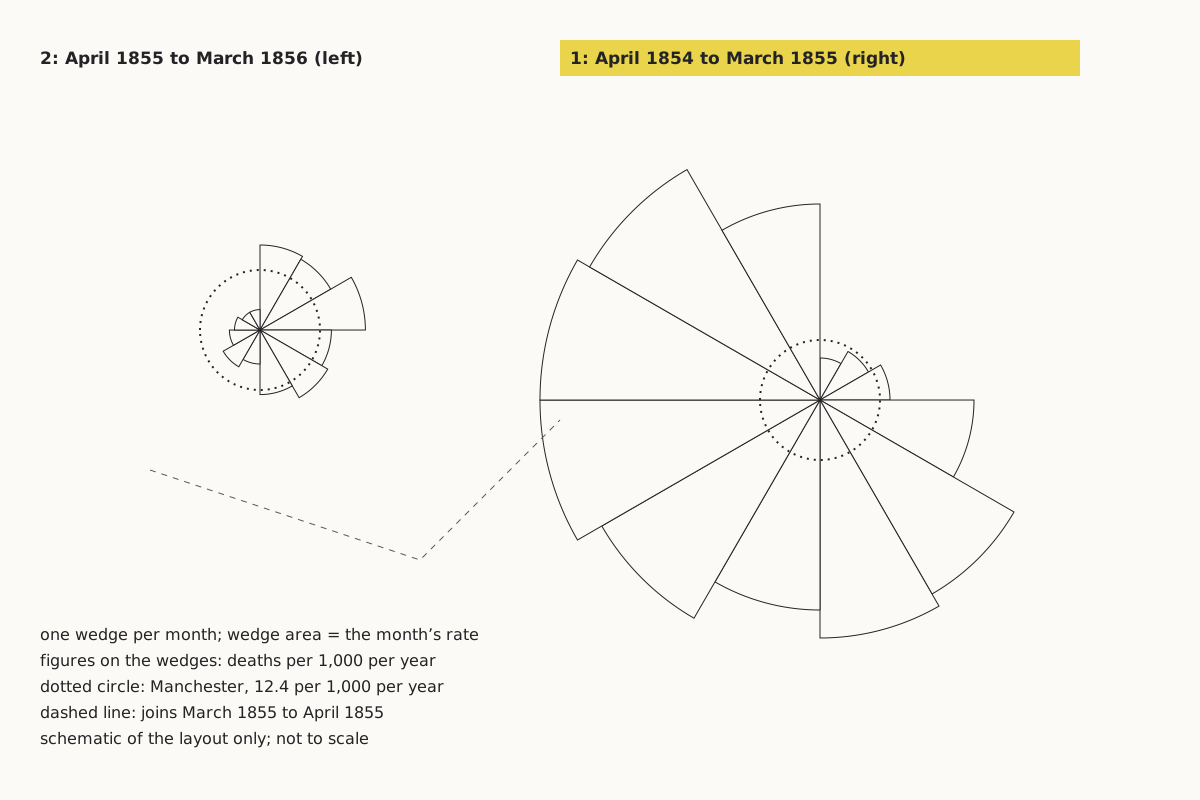
Wide figure: scroll it sideways, or open it full size.
The parts of the 1858 plate, drawn as a schematic: two roses, a dotted circle in each, and a dashed line between them.
Diagram: Puzzles, Charts & Dilemmas, CC BY 4.0
Copy the full credit line
"Parts of the 1858 plate Diagrams of the Mortality in the Army in the East (schematic)" by Puzzles, Charts & Dilemmas, https://puzzleschartsanddilemmas.com/charts/nightingale-rose-diagram/, licensed under CC BY 4.0 (https://creativecommons.org/licenses/by/4.0/).
Data: Florence Nightingale, Notes on Matters Affecting the Health, Efficiency, and Hospital Administration of the British Army (1858), Table No. 2, p. 315; Wellcome Library copy, public domain
Each rose has a dotted circle near its centre. The key, lettered in script, says the circle shows what the mortality would have been had the army been “as healthy as Manchester,” at 12.4 per 1,000 per year, and that the figures on the wedges “show the Mortality per 1000 per Annum.” By the table, 20 of the 24 months exceed that benchmark, and January 1855, at 1,173.5, is 94.6 times it.
The plate's wedges carry one figure per month, for all causes together. We could read 15 of those figures, and each one equals the sum of that month's three rates in Table No. 2; January 1855, for instance, reads 1173.5.
We did not find the causes diagram listed for page 315 among the pages of this copy that we viewed, so this page does not describe its colours or wording. The plate itself is not reproduced here, and the roses above are our own drawing from Table No. 2. Nightingale also issued A Contribution to the Sanitary History of the British Army during the Late War with Russia (London, 1859), but we have only its catalogue record, so we say nothing about its contents.
Push back:
The strongest objection is that the rose was never meant to be read like a bar chart. Nightingale printed her tables in the same book, with rates and counts both, and the plate's own key explains the area rule and the Manchester circle. A reader in 1858 who wanted exact values had them a few pages away. Treating the bars as the more honest version, then, judges a chart built to persuade by the standard of a chart built for looking up numbers.
- Minard's map: Another chart from the same era, read against its own numbers.
- Simpson's paradox: Another chart where a rate means nothing until you check its denominator.
Sources
- Florence Nightingale, Notes on Matters Affecting the Health, Efficiency, and Hospital Administration of the British Army, Founded Chiefly on the Experience of the Late War (London: Harrison, 1858), Table No. 1 (p. 314), Table No. 2 (p. 315), list of illustrations, and the folding plate “Diagrams of the Mortality in the Army in the East.” Wellcome Library copy, digitized by the Internet Archive. https://archive.org/details/b20387118 Read: Tables No. 1 and 2 (pp. 314–315), the list of illustrations and one folding plate, from page images of the Wellcome Library copy. Text license: Public Domain Mark 1.0.
- Wellcome Collection, catalogue record for Florence Nightingale, Notes on Matters Affecting the Health, Efficiency, and Hospital Administration of the British Army (1858): xix, 12, 567 pages, 5 unnumbered folded leaves of plates; digitized copy marked Public Domain Mark. https://wellcomecollection.org/works/jxwtskzc Read: catalogue record (bibliographic details and licence).
- Florence Nightingale, A Contribution to the Sanitary History of the British Army during the Late War with Russia (London: printed by Harrison, 1859). Wellcome Collection catalogue record. https://wellcomecollection.org/works/fecwftff Read: bibliographic record only.
Downloads: Table No. 2, all 24 months (CSV) (file notes: source, version and license (JSON)) Data: Florence Nightingale, Notes on Matters Affecting the Health, Efficiency, and Hospital Administration of the British Army (1858), Table No. 2, p. 315; Wellcome Library copy, public domain · Every rate recomputed (CSV) (file notes: source, version and license (JSON)) Data: Florence Nightingale, Notes on Matters Affecting the Health, Efficiency, and Hospital Administration of the British Army (1858), Table No. 2, p. 315; Wellcome Library copy, public domain · Totals and counts quoted on this page (CSV) (file notes: source, version and license (JSON)) Data: Florence Nightingale, Notes on Matters Affecting the Health, Efficiency, and Hospital Administration of the British Army (1858), Table No. 2, p. 315; Wellcome Library copy, public domain · Area and radius ratios (CSV) (file notes: source, version and license (JSON)) Data: Florence Nightingale, Notes on Matters Affecting the Health, Efficiency, and Hospital Administration of the British Army (1858), Table No. 2, p. 315; Wellcome Library copy, public domain
Cite this page
Puzzles, Charts & Dilemmas. “Nightingale Rose Diagram: Its Monthly Rates Are Yearly Rates.” Puzzles, Charts & Dilemmas. Published 2026-10-31. https://puzzleschartsanddilemmas.com/charts/nightingale-rose-diagram/. Accessed: add the date you read it.
Dates are given as year-month-day. 31 October 2026 is the latest substantive revision.
Simpson's Paradox: One Berkeley Table, Two Honest Summaries
Picture credit
"Greek Theatre, University of California" by Brück & Sohn Kunstverlag Meißen — https://commons.wikimedia.org/wiki/File:06849-Kalifornien-1905-Greek_Theatre,_University_of_California-Br%C3%BCck_%26_Sohn_Kunstverlag.jpg — CC0 1.0 (https://creativecommons.org/publicdomain/zero/1.0/)

Minard's Map: By His Figures, Most Losses Came Before Winter
Picture credit
Illustration: Puzzles, Charts & Dilemmas. Generated schematic illustration — not a photograph or historical record. Reuse: CC BY 4.0 (https://creativecommons.org/licenses/by/4.0/), to the extent Puzzles, Charts & Dilemmas holds rights in it.

Anscombe's Quartet: One Fitted Line, Four Different Shapes
Picture credit
Illustration: Puzzles, Charts & Dilemmas. Generated schematic illustration — not a photograph or historical record. Reuse: CC BY 4.0 (https://creativecommons.org/licenses/by/4.0/), to the extent Puzzles, Charts & Dilemmas holds rights in it.