Minard's Map: By His Figures, Most Losses Came Before Winter
Published · Puzzles, Charts & Dilemmas
Folded answers print open where the browser allows it; if one prints closed, open it at https://puzzleschartsanddilemmas.com/charts/minard-map/ first.
Where it lands
By the figures printed on Charles Minard's 1869 map, the French army's main column fell from 422,000 men at the Niemen to 100,000 near Moscow before the retreat began, and his bands shrink by a net 412,000 men over the campaign, 267,000 of them by the last figures of the advance. His counts are of men no longer on the map, which is not the same as deaths, and his first temperature below zero is dated 9 November, on the retreat.
Sections on this sheet (6)
In 1869, Charles Minard drew one shrinking band for the French army's 1812 campaign in Russia. A quick look suggests that the cold destroyed the army, since the black band of the retreat thins above a temperature line that falls to 30 degrees below zero. That reading puts the narrowing and the cold in the same stretch of time. Here it is as an argument, before we check it against his own numbers.
In standard form:
- Premise 1:The band narrows sharply across Russia.
- Premise 2:The temperature line plunges during the retreat.
- Therefore, conclusion:The Russian winter destroyed the army.
Four walkers at a river, on a track worn far wider than four people could make.
Illustration: Puzzles, Charts & Dilemmas. Generated schematic illustration — not a photograph or historical record. Reuse: CC BY 4.0 (https://creativecommons.org/licenses/by/4.0/), to the extent Puzzles, Charts & Dilemmas holds rights in it.
P1 and P2 are both true of the map. The conclusion needs a third premise that the map does not supply: that the narrowing happened while it was cold. The map dates only the temperatures. It plots them only under the retreat.
What the original map shows
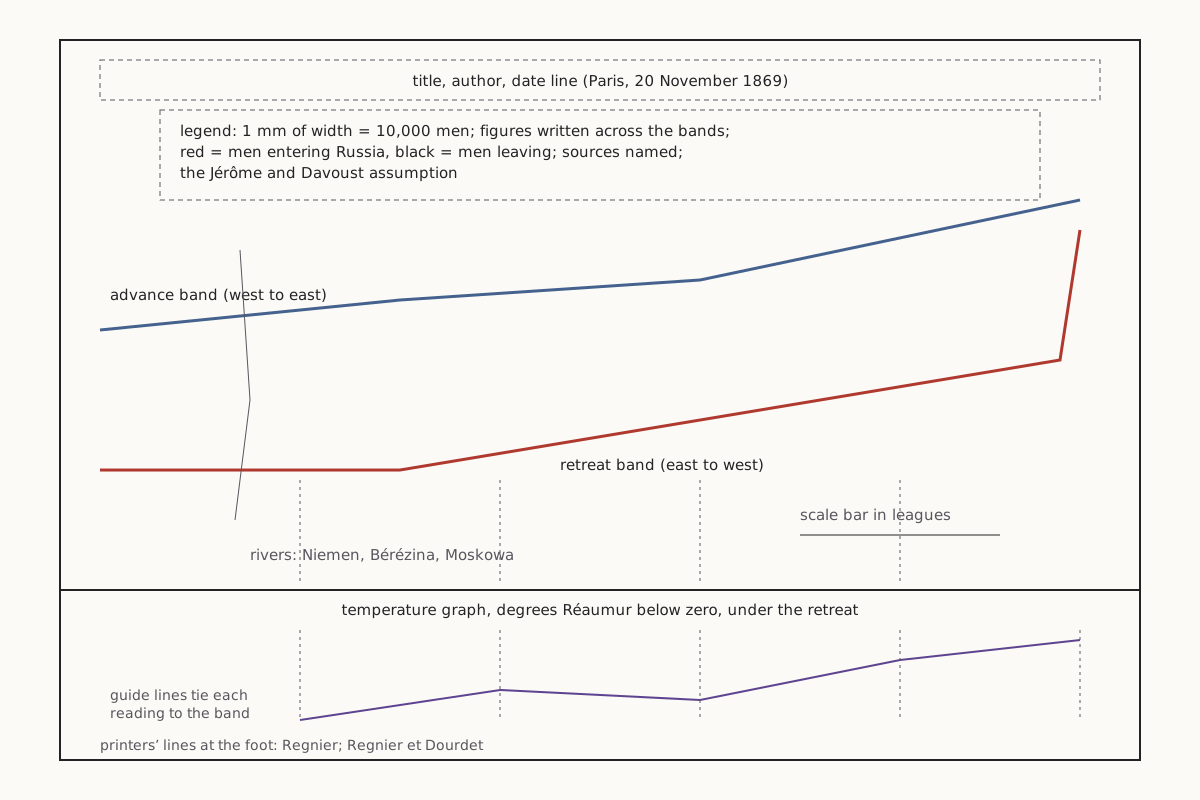
The map is titled “Carte figurative des pertes successives en hommes de l'Armée Française dans la campagne de Russie 1812–1813,” a figurative map of the French army's successive losses of men. It says it was drawn up by Minard, a retired inspector general of the Ponts et Chaussées, and it is dated “Paris, le 20 Novembre 1869.”
Wide figure: scroll it sideways, or open it full size.
The parts of Minard's 1869 map, drawn as a schematic rather than a copy.
Diagram: Puzzles, Charts & Dilemmas, CC BY 4.0
Copy the full credit line
"Minard 1869: the parts of the map (schematic)" by Puzzles, Charts & Dilemmas, https://puzzleschartsanddilemmas.com/charts/minard-map/, licensed under CC BY 4.0 (https://creativecommons.org/licenses/by/4.0/).
Data: Charles Minard, Carte figurative des pertes successives en hommes de l'Armée Française dans la campagne de Russie 1812–1813 (1869), public domain; figures transcribed from the copy on Wikimedia Commons, retrieved 2026-10-31
The legend sets the scale: the width of each band shows the men present, at one millimetre for every 10,000 men, and the numbers are also written across the bands. It says the red band marks the men entering Russia and the black band the men leaving it. In the copy we read, the advance band is printed in a pale tan, so we call the two bands the advance and the retreat.
Under the map runs a separate “Tableau graphique” of the temperature in degrees of the Réaumur thermometer below zero. Thin vertical guide lines tie each reading to a point on the retreat band. Nothing ties a date to the advance band.
Same data, redrawn
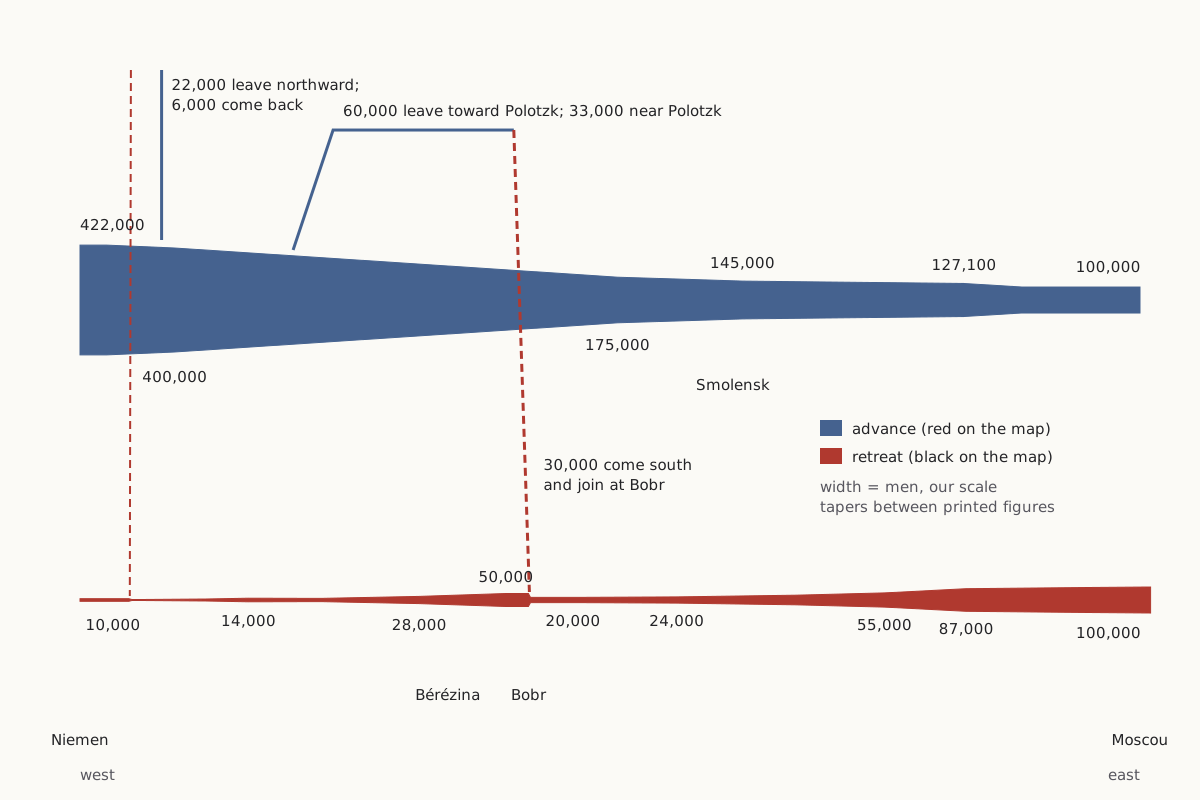
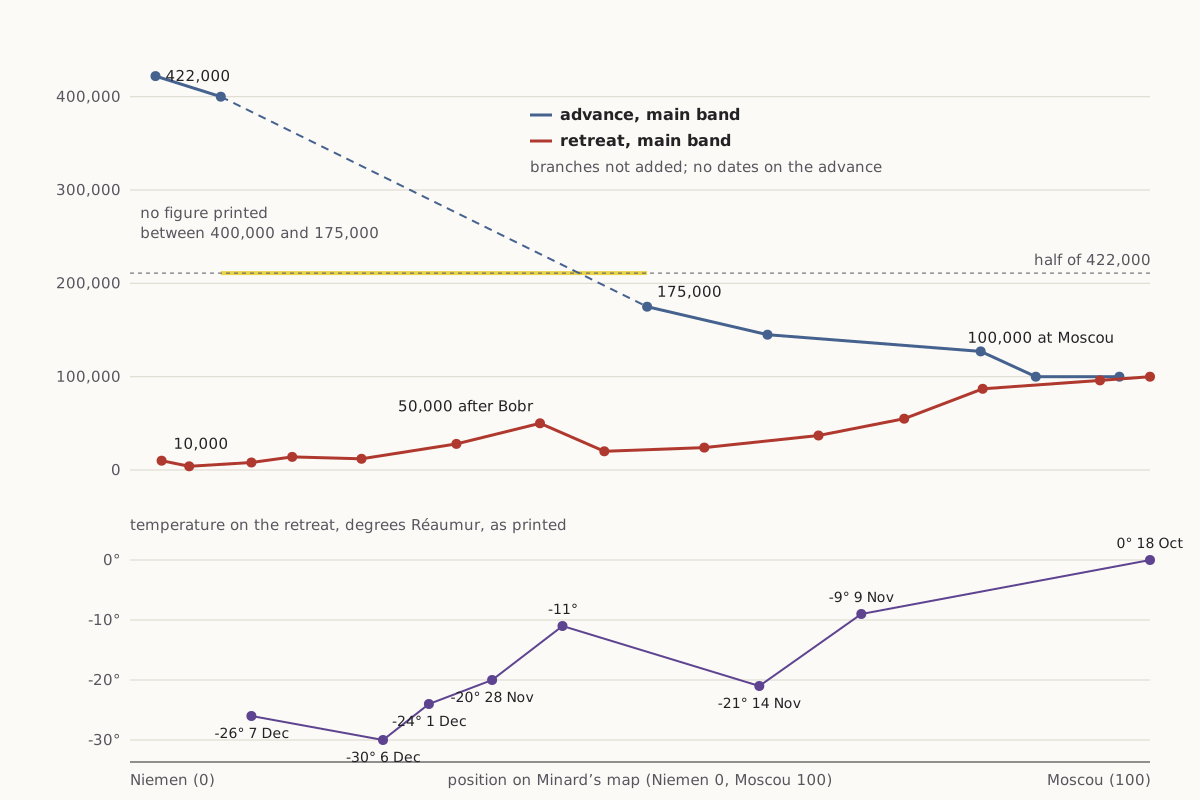
Both charts below come from the same transcription of the map's 26 troop figures and 9 temperature labels. The first keeps Minard's idea, width for men, in our own layout. The second puts the main band's figures on a plain vertical scale against where each figure sits on his map, from the Niemen at 0 to Moscow at 100.
As first charted
Wide figure: scroll it sideways, or open it full size.
Minard's figures as flow bands in our layout, the width of each band set by the number of men.
Diagram: Puzzles, Charts & Dilemmas, CC BY 4.0
Copy the full credit line
"Minard's 1812 figures as flow bands, our layout" by Puzzles, Charts & Dilemmas, https://puzzleschartsanddilemmas.com/charts/minard-map/, licensed under CC BY 4.0 (https://creativecommons.org/licenses/by/4.0/).
Data: Charles Minard, Carte figurative des pertes successives en hommes de l'Armée Française dans la campagne de Russie 1812–1813 (1869), public domain; figures transcribed from the copy on Wikimedia Commons, retrieved 2026-10-31
Same numbers, redrawn
Wide figure: scroll it sideways, or open it full size.
The main band's figures against position on the map, with the dated temperature readings on the same horizontal axis.
Diagram: Puzzles, Charts & Dilemmas, CC BY 4.0
Copy the full credit line
"Minard's main band against position on the map, with temperatures" by Puzzles, Charts & Dilemmas, https://puzzleschartsanddilemmas.com/charts/minard-map/, licensed under CC BY 4.0 (https://creativecommons.org/licenses/by/4.0/).
Data: Charles Minard, Carte figurative des pertes successives en hommes de l'Armée Française dans la campagne de Russie 1812–1813 (1869), public domain; figures transcribed from the copy on Wikimedia Commons, retrieved 2026-10-31
On the flow bands, the eye goes to the thin black ribbon of the retreat. On the line chart, the steepest fall is the advance, between the 400,000 printed after Kowno and the 175,000 printed past Witebsk. Minard prints no figure in between, so the dashed line only joins the two figures he gives.
The advance band carries no dates at all, so we used position on the map instead. We did not convert that position into longitude or distance either, because the map has no longitude grid. It does carry a scale bar in leagues, attributed to a map by Fezensac. We have no second source to check it against.
Try it first: On the right-hand chart, where along the route had the main column lost half of its starting 422,000?
Show it worked through
Worked through
Half of 422,000 is 211,000. The last figure above that on the main band is 400,000, between Kowno and Wilna, and the next one printed is 175,000, between Witebsk and Smolensk, at 50.7 on our 0 to 100 scale of the map.
So by Minard's figures the main column was below half before it reached Smolensk, still on the advance. If the two labelled branches are added back in, the three bands together hold 230,000 at that point and 200,000 at the next figure, 145,000, between Smolensk and Dorogobouge.
| Point on the map | Main band | Polotzk branch | Branch north of Kowno | All three |
|---|---|---|---|---|
| Between Kowno and Wilna | 400,000 | not yet split | 22,000 | 422,000 |
| Between Witebsk and Smolensk | 175,000 | 33,000 | 22,000 | 230,000 |
| Between Smolensk and Dorogobouge | 145,000 | 33,000 | 22,000 | 200,000 |
Either way, the halfway point comes before Moscow and before any temperature on the map.
Advance against retreat
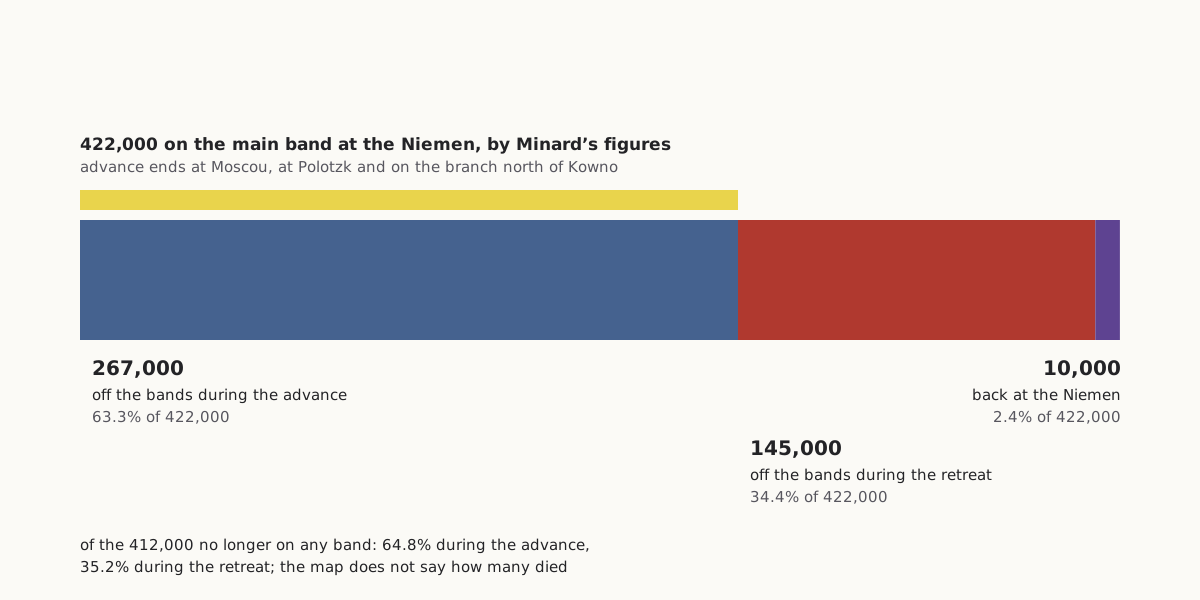
Count everyone on the map at the last figure each band carries before it turns back. The main band reaches Moscow with 100,000, the Polotzk branch shows 33,000 and the branch north of Kowno 22,000, a total of 155,000. Of the 422,000 who started, 267,000, or 63.3%, are no longer on any band at those last advance figures.
Wide figure: scroll it sideways, or open it full size.
Where the 422,000 men of the starting band end up, by Minard's own figures.
Diagram: Puzzles, Charts & Dilemmas, CC BY 4.0
Copy the full credit line
"422,000 men by Minard’s figures: off the bands on the advance, on the retreat, back" by Puzzles, Charts & Dilemmas, https://puzzleschartsanddilemmas.com/charts/minard-map/, licensed under CC BY 4.0 (https://creativecommons.org/licenses/by/4.0/).
Data: Charles Minard, Carte figurative des pertes successives en hommes de l'Armée Française dans la campagne de Russie 1812–1813 (1869), public domain; figures transcribed from the copy on Wikimedia Commons, retrieved 2026-10-31
The retreat brings 10,000 back to the Niemen, so the bands end a net 145,000 smaller; the drops alone add up to 147,000, less the one rise of 2,000 noted below. Over the whole campaign the bands shrink by a net 412,000: 267,000, or 64.8%, on the advance and 145,000, or 35.2%, on the retreat. The title's claim that most losses came before winter rests on that 64.8%.
The count stops at Moscow, where the temperature graph begins with zero on 18 October, three weeks before its first reading below zero. The two branches carry no dates, so their last advance figures need not fall on the day the main band reached Moscow. Even if every man they lose is counted on the retreat, the main band alone loses 240,000 on the advance, 58.3% of the net 412,000.
The retreat is still severe. The main band goes from 100,000 at Moscow to 20,000 at Bobr, takes in 30,000 there, and is down to 4,000 before the last branch rejoins near the Niemen. A total like 422,000 can hide that kind of structure, just as a single admissions rate does on our Simpson's paradox page, and Anscombe's quartet shows four datasets that its headline statistics, to two significant figures, cannot tell apart.
| Main band, retreat | Men | Next figure | Drop |
|---|---|---|---|
| Moscou to Tarantino | 100,000 | 96,000 | 4,000 |
| Malo-jarosewli to Mojaisk | 96,000 | 87,000 | 9,000 |
| Mojaisk to Wizma | 87,000 | 55,000 | 32,000 |
| Wizma to Dorogobouge | 55,000 | 37,000 | 18,000 |
| Dorogobouge to Smolensk | 37,000 | 24,000 | 13,000 |
| Smolensk to Orscha | 24,000 | 20,000 | 4,000 |
| Bobr to Studienska, after 30,000 join | 50,000 | 28,000 | 22,000 |
| West of the Bérézina | 28,000 | 12,000 | 16,000 |
All 26 troop figures, with their place on the map, are in the CSV under Sources.
Where the men went
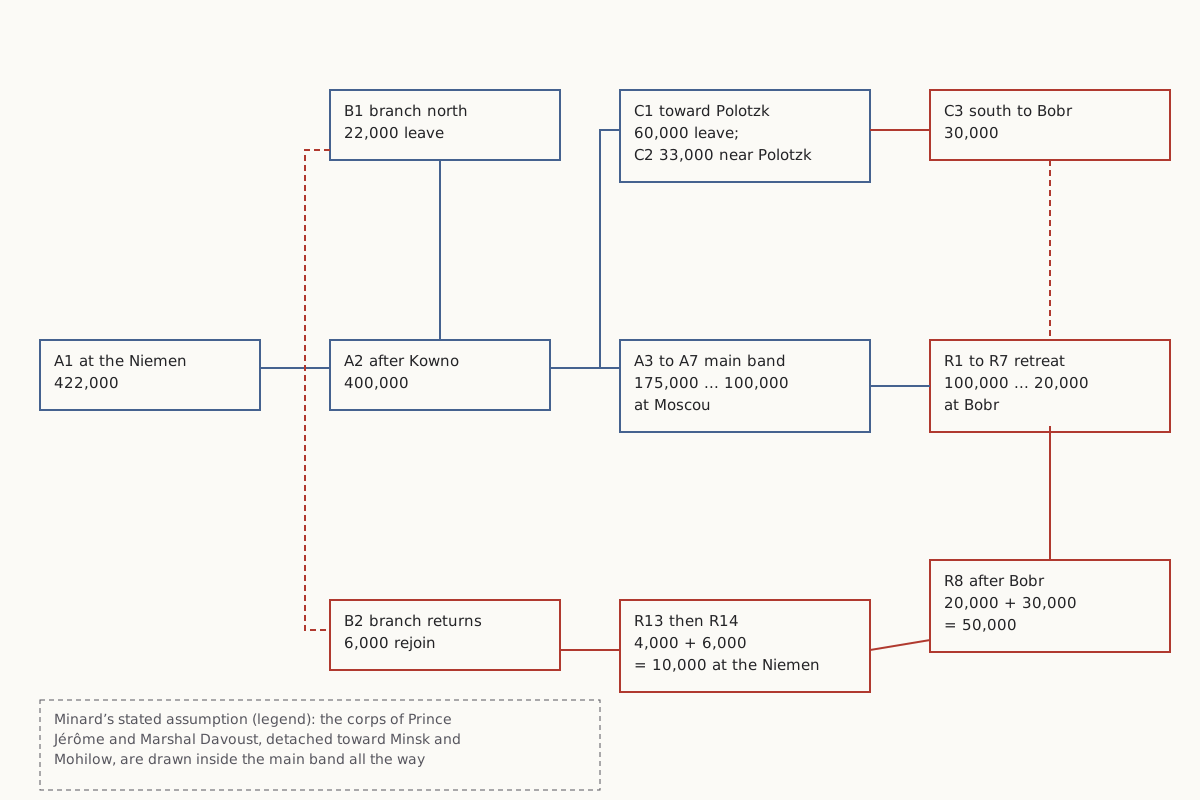
Not everyone who leaves a band has died. Two branches leave the main band during the advance: 22,000 head north near Kowno, and 60,000 turn off past Wilna toward Polotzk. Together those are 82,000 of the 322,000 by which the main band falls between the Niemen and Moscow.
Wide figure: scroll it sideways, or open it full size.
The three bands on Minard's map, where they split off and where they join again.
Diagram: Puzzles, Charts & Dilemmas, CC BY 4.0
Copy the full credit line
"Minard 1869: the three bands, where they split and join" by Puzzles, Charts & Dilemmas, https://puzzleschartsanddilemmas.com/charts/minard-map/, licensed under CC BY 4.0 (https://creativecommons.org/licenses/by/4.0/).
Data: Charles Minard, Carte figurative des pertes successives en hommes de l'Armée Française dans la campagne de Russie 1812–1813 (1869), public domain; figures transcribed from the copy on Wikimedia Commons, retrieved 2026-10-31
| Band | Leaves with | Later figures | Rejoins |
|---|---|---|---|
| Branch north of Kowno | 22,000 | 6,000 on the way back | near the Niemen, making 10,000 |
| Branch toward Polotzk | 60,000 | 33,000 near Polotzk; 30,000 heading south | at Bobr, making 50,000 |
| Main band | 422,000 at the Niemen | 400,000; 175,000; 145,000; 127,100; 100,000 at Moscou | — |
The map's own arithmetic holds at every join: 422,000 less 22,000 is the 400,000 printed next, 20,000 plus 30,000 is the 50,000 after Bobr, and 4,000 plus 6,000 is the 10,000 at the Niemen. One figure goes the other way, and the band rises from 12,000 near Molodezno to 14,000 toward Wilna without any note to say why.
A figure like the 10,000 at the Niemen is the lone count until it is set against the 422,000 who crossed and the 6,000 of them who came from the northern branch. Even then the map cannot say what happened to the men who are missing. They may have died, deserted, fallen sick, or been left behind on duty, and the bands only show that they are no longer there.
The legend also folds two detachments into the main band on purpose. To make the shrinking easier to judge by eye, Minard writes, he assumed that the corps of Prince Jérôme and of Marshal Davoust (the map's spelling), detached toward Minsk and Mohilow, “avaient toujours marché avec l'armée,” had always marched with the army. So the main band includes men who were elsewhere for part of the advance.
The temperature line
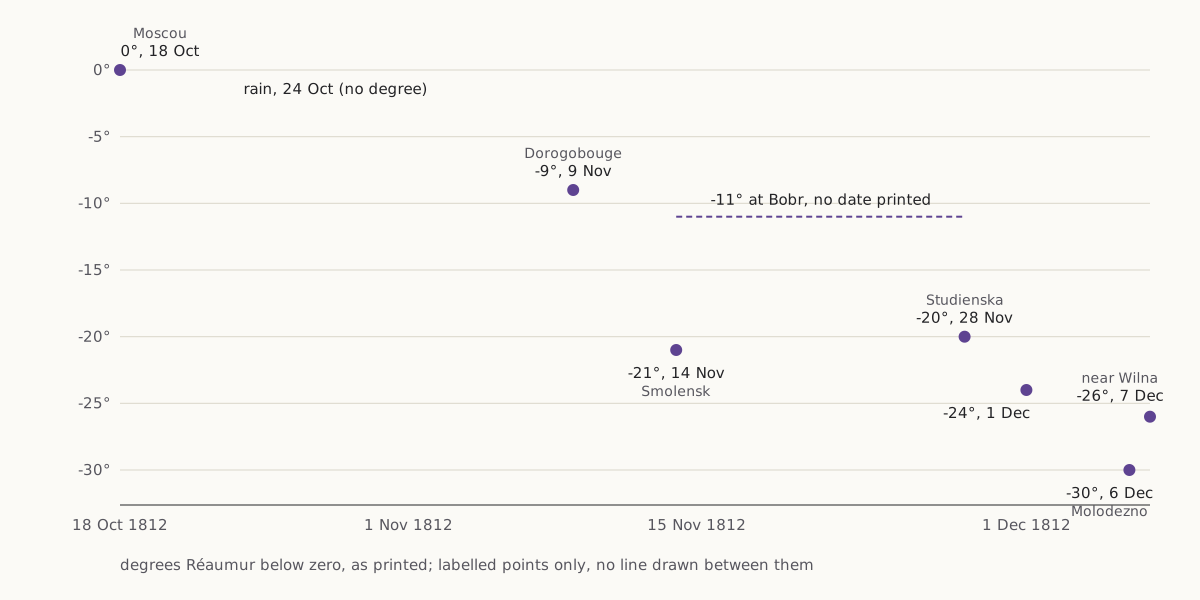
The temperature graph starts at Moscow with “Zéro le 18 8bre,” zero on 18 October, where 8bre, 9bre and Xbre are the abbreviations the map uses for October, November and December. The next label is “Pluie 24 8bre,” rain on 24 October, with no degree. The first reading below zero is minus 9 on 9 November, drawn at Dorogobouge.
Wide figure: scroll it sideways, or open it full size.
Minard's temperature labels in degrees Réaumur, placed by the dates he prints.
Diagram: Puzzles, Charts & Dilemmas, CC BY 4.0
Copy the full credit line
"Minard 1869: temperature labels in degrees Réaumur by date" by Puzzles, Charts & Dilemmas, https://puzzleschartsanddilemmas.com/charts/minard-map/, licensed under CC BY 4.0 (https://creativecommons.org/licenses/by/4.0/).
Data: Charles Minard, Carte figurative des pertes successives en hommes de l'Armée Française dans la campagne de Russie 1812–1813 (1869), public domain; figures transcribed from the copy on Wikimedia Commons, retrieved 2026-10-31
| Date printed | Degrees Réaumur | Where the guide line meets the retreat |
|---|---|---|
| 18 October | 0 | Moscou |
| 24 October | rain, no degree | no guide line |
| 9 November | −9 | Dorogobouge |
| 14 November | −21 | Smolensk |
| no date | −11 | Bobr |
| 28 November | −20 | Studienska, on the Bérézina |
| 1 December | −24 | between Studienska and Molodezno |
| 6 December | −30 | Molodezno |
| 7 December | −26 | near Wilna |
When the first reading below zero is drawn at Dorogobouge, the main band arriving there is down to 55,000, which is 45,000 fewer than left Moscow. The cold readings do line up with the stretch where the main band falls from 55,000 to 20,000 before Bobr, and then from 50,000 to 4,000 after it. The worst of the cold on the map, 30 degrees below zero on 6 December, is drawn at Molodezno, where the main band goes from 28,000 to 12,000.
The map gives the temperatures in Réaumur degrees, as its heading says. We keep them that way and have not converted them to Celsius on this page, so the table above shows exactly what the map prints.
Where Minard got his numbers
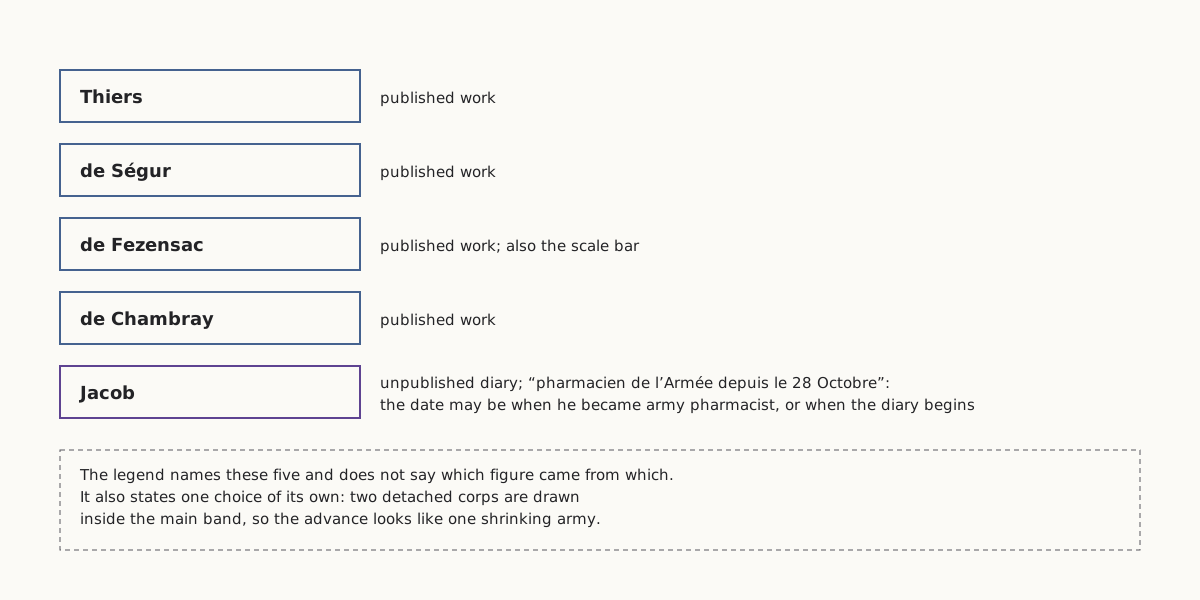
Every figure on the map is Minard's, but he says he took his information from others. The legend names “MM. Thiers, de Ségur, de Fezensac, de Chambray” and “le journal inédit de Jacob, pharmacien de l'Armée depuis le 28 Octobre,” the unpublished diary of Jacob, an army pharmacist. The French can be read two ways, and the legend does not settle which: Jacob had been the army's pharmacist since 28 October, or his diary runs from that date.
Wide figure: scroll it sideways, or open it full size.
The five sources named in Minard's legend, and the one assumption the legend states.
Diagram: Puzzles, Charts & Dilemmas, CC BY 4.0
Copy the full credit line
"Minard 1869: the sources named in the legend" by Puzzles, Charts & Dilemmas, https://puzzleschartsanddilemmas.com/charts/minard-map/, licensed under CC BY 4.0 (https://creativecommons.org/licenses/by/4.0/).
Data: Charles Minard, Carte figurative des pertes successives en hommes de l'Armée Française dans la campagne de Russie 1812–1813 (1869), public domain; figures transcribed from the copy on Wikimedia Commons, retrieved 2026-10-31
The legend does not say which figure came from which source. The phrases “By His Figures” in our title and “by Minard's figures” in our text are there for that reason: we checked that the numbers on the map are consistent with one another, not that they are right about 1812. We read the works he names only as names on his legend, and we have not compared his figures with theirs or with any later estimate.
The copy we read is a public-domain image on Wikimedia Commons whose scan source is not recorded, so we used it only to read the numbers and we do not reproduce it here. The charts on this page are our own drawings from that transcription.
Reading a flow map like this one
The same checks work on any chart that draws a crowd as a band:
- Find what one unit of width stands for (here, one millimetre for 10,000 men) and whether the figures are also written on the band.
- Find which axis carries time. On this map only the temperature graph has dates, so the advance can be ordered but not timed.
- Add up every band at the point you care about, including branches that leave and rejoin, before you compare two places.
- Ask what leaving a band means. Here it can stand for deaths, desertion, sickness or men left behind, and the map does not separate them.
- Check whether the mapmaker merged or moved any group on purpose, as Minard did with the two detached corps he names.
- Put the dated readings next to the figures they sit beside, and read the order of events from the guide lines, not from where the colours look darkest.
Push back:
The strongest objection is that splitting the campaign into an advance and a retreat is a false division. Many of the men who left the bands on the advance may have been detached or left behind rather than killed, and sickness and failing supply before Moscow could owe as much to distance and weather as the later cold did. On that view, the map's real subject is one campaign that wore the army down from the first day, and the date of the first frost is a detail.
- Nightingale rose diagram: Another wartime chart from the same era, with its own denominators to check.
- River crossing puzzle: The map marks a river crossing too; here is a crossing puzzle with every move checked.
Sources
- Charles Joseph Minard, Carte figurative des pertes successives en hommes de l'Armée Française dans la campagne de Russie 1812–1813, dated on the map “Paris, le 20 Novembre 1869”; printers' lines “Autog. par Regnier, 8. Pas. Ste Marie St Gain à Paris” and “Imp. Lith. Regnier et Dourdet.” As reproduced on Wikimedia Commons, File:Minard.png (scan source not recorded). https://commons.wikimedia.org/wiki/File:Minard.png Read: the map image: the Bérézina label and the legend line on the black band; also the whole map: title, legend, every troop figure and place name, the temperature graph and the scale bar, from the full-size image.

Downloads: All 26 troop figures with their place on the map (CSV) (file notes: source, version and license (JSON)) Data: Charles Minard, Carte figurative des pertes successives en hommes de l'Armée Française dans la campagne de Russie 1812–1813 (1869), public domain; figures transcribed from the copy on Wikimedia Commons, retrieved 2026-10-31 · Temperature labels (CSV) (file notes: source, version and license (JSON)) Data: Charles Minard, Carte figurative des pertes successives en hommes de l'Armée Française dans la campagne de Russie 1812–1813 (1869), public domain; figures transcribed from the copy on Wikimedia Commons, retrieved 2026-10-31 · Sums and shares quoted on this page (CSV) (file notes: source, version and license (JSON)) Data: Charles Minard, Carte figurative des pertes successives en hommes de l'Armée Française dans la campagne de Russie 1812–1813 (1869), public domain; figures transcribed from the copy on Wikimedia Commons, retrieved 2026-10-31
Cite this page
Puzzles, Charts & Dilemmas. “Minard's Map: By His Figures, Most Losses Came Before Winter.” Puzzles, Charts & Dilemmas. Published 2026-10-31. https://puzzleschartsanddilemmas.com/charts/minard-map/. Accessed: add the date you read it.
Dates are given as year-month-day. 31 October 2026 is the latest substantive revision.
Simpson's Paradox: One Berkeley Table, Two Honest Summaries
Picture credit
"Greek Theatre, University of California" by Brück & Sohn Kunstverlag Meißen — https://commons.wikimedia.org/wiki/File:06849-Kalifornien-1905-Greek_Theatre,_University_of_California-Br%C3%BCck_%26_Sohn_Kunstverlag.jpg — CC0 1.0 (https://creativecommons.org/publicdomain/zero/1.0/)
Nightingale Rose Diagram: Its Monthly Rates Are Yearly Rates
Picture credit
"One of the wards in the hospital at Scutari" by William Simpson (artist) and E. Walker (lithographer) — https://commons.wikimedia.org/wiki/File:%27One_of_the_wards_in_the_hospital_at_Scutari%27._Wellcome_M0007724.jpg — CC BY 4.0 (https://creativecommons.org/licenses/by/4.0/)

Anscombe's Quartet: One Fitted Line, Four Different Shapes
Picture credit
Illustration: Puzzles, Charts & Dilemmas. Generated schematic illustration — not a photograph or historical record. Reuse: CC BY 4.0 (https://creativecommons.org/licenses/by/4.0/), to the extent Puzzles, Charts & Dilemmas holds rights in it.